Electric cars are not really zero emission vehicles, they just shift the pollution away from where they’re driven to where the power is produced. Most are powered mostly by burning coal which is dirtier and more environmentally destructive than burning gasoline.
Most gas cars are probably more efficient than electric cars, if you take into consideration all the waste in the process of mining and burning the coal and transmitting the electricity from the power plant to wherever the electric car is charged.
I heard these two claims from a friend last week. He accepts the scientific consensus about climate change caused by human industry, and is a strong environmentalist. Yet both claims are very wrong. Why would he hold these misconceptions? Maybe because while electric cars have been around 100 years, they’ve only recently become mainstream–readily purchasable from a variety of established car companies. Only a few years ago they were complex, cobbled-together “conversions” from gas-engine cars. Today’s electric cars really are new and different, and not yet widely understood. And there are well-funded misinformation campaigns from vested interests ready to amplify every problem, half-truth and lie regarding electric cars, trying to keep alive the fear, uncertainty and doubt. Probably these campaigns have an effect, especially since they’re being used against unfamiliar new technology.
My friend hadn’t found research comparing electric cars and gas-engine car emissions and efficiency. Because grid electricity is produced from different sources in different states, the comparison will vary state by state (as well as country by country). We live in California so I will address these two statements from a California-centric perspective. Details follow this summary of the conclusions derived below.
Conclusions
- Electric cars in California emit far less CO2 than gas-engine cars, and are far more efficient even considering the entire supply chain, from “well to tank” and from “tank to wheels.”
Debunking Claim 1 (CO2 Emissions)
- Gas-powered cars emit at least 9 times as much CO2 per mile driven, as electric cars.
Debunking Claim 2 (Overall Efficiency and Waste)
- Significantly more energy is required for oil and gasoline transport from wells to the end user (gas station), than for fuel transport from wells to electrical generating plants and electricity transmission and distribution to the end user (home or office or other charging station).
- Significantly more waste from environmental and health issues is associated with the oil and gasoline supply chain from the well to the gas station, than with the fuel and electricity supply chain to the electric car charging station.
- There is no significant military involvement in protecting the energy supply for electric cars.
- There is enormous waste (and casualties) for the military protection of the oil supply chain required for our gas cars.
- There is over 9 times as much cost based on California climate change remediation for gas cars, than for electric cars.
Details
Electric cars are not really zero emission vehicles, they just shift the pollution away from where they’re driven to where the power is produced. Most are powered mostly by burning coal which is dirtier and more environmentally destructive than burning gasoline.
It’s true that electric cars are powered by electricity, and a lot of electricity is generated from burning coal. In the US in 2013, 39% of our electricity was generated from coal. For reference from that page: Natural Gas 27%; Nuclear 19%; Hydropower 7%; Wind 4.13%; Biomass 1.48%; Petroleum 1%; Geothermal 0.41%; Solar 0.23%; Other Gases < 1%.
However in California, coal power provides only about 1% of our electricity. 60% is from natural gas followed by Hydropower 13%; Nuclear 9%; Geothermal 7%; Wind 5%; Biomass 3%; Solar, Coal, and Other Gases are each 1%. Comparisons between electric cars and gas cars in California should not be based on coal. Other factors are relevant:
- California has a Renewable Portfolio Standard (RPS) which by law requires 33% of our electricity to be generated by renewable sources by 2020; over 20% is renewable now in 2014, with PG&E supplying the most of California’s three large investor-owned utilities, at 23.8% in 2013. Electric cars are more and more running on carbon-free electricity.
- Some utilities offer customers a renewable-energy option to pay a higher price for clean energy (for example, PG&E).
- Many electric car owners are aware of and concerned about carbon emissions, and many have installed solar power on their roofs to supply cleaner as well as cheaper electricity.
For simplicity, even though electric car drivers often try to consume relatively cleaner electricity, assume a generous 65% of California’s electricity generation to be carbon emitting, 35% to be carbon free. Burning one gallon of gasoline generates nearly 20 pounds of CO2. Natural gas is not typically measured in gallons, but it’s easy to normalize by comparing how much CO2 each fuel emits to produce a given amount of energy. British Thermal Units (BTUs) are commonly used to compare energy generation. Burning natural gas emits 117 pounds of carbon dioxide (CO2) per million BTUs and burning gasoline emits 157 pounds per million BTUs. Natural gas emits about 117/157 or about 75% of the CO2 of gasoline.
Emissions Per Unit of Energy Consumed
To compare emissions, gas cars emit 157 pounds of CO2 per million BTUs of energy consumed, electric cars emit 65% of 117 pounds or about 76 pounds of CO2 per million BTUs of energy consumed (because the electric cars are powered 65% by CO2-emitting fuel). Therefore, even considering the emissions from the fossil fuels plants that generate electricity for their batteries, gas cars emit at least twice as much CO2 as electric cars (157 divided by 76).
This effectively debunks the assertion that electric cars are dirtier and more environmentally destructive than gas engine cars. But the truth is even more in favor of electric cars, because gas cars are far less efficient in terms of energy needed per mile driven.
Emissions Per Mile Driven
Gasoline-powered engines are 25 to 30% efficient. “Tank to wheel” efficiency numbers are meant to indicate the overall efficiency (for example including the drive train, not just that of the engine) of a gas-powered car. One careful estimate calculates this overall efficiency at 16%. Of course this will vary by type of car. This particular estimate was for a car that gets 26 MPG.
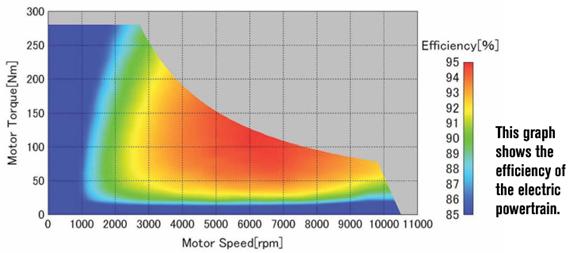
Electric motors are about 90% efficient. The graph shows the efficiency of the Nissan Leaf’s motor, and that almost all driving is done at or above 90% efficiency.
There’s no transmission in an electric car so no losses from gear changes. There’s no starter motor, and electric cars never “idle” meaning efficiency doesn’t drop in stop-and-go driving. There are losses in converting the electricity from grid-AC to battery DC and back to AC to drive the motor. One careful estimate sets electric car “tank to wheel” efficiency at 73%, using .9 (motor efficiency) times .95 (inverter efficiency) times .9 (battery efficiency) times .95 (charger efficiency).
Therefore, tank to wheel efficiency of electric cars is 4.5 times that of gas-powered cars (73% divided by 16%). However, this neglects “regenerative braking” where stepping off the accelerator pedal recharges the battery (great for city traffic and mountain roads). How much effect this has varies greatly with driving conditions; one study of buses (which stop and start a lot) found efficiency could be improved by between 15% and 30%, meaning tank to wheel efficiency would improve from 73% to between 77% and 81% (that is, adding back 15% to 30% of the 100-73 = 27% wasted). Thus regenerative braking may push electric cars more toward 5 times as efficient “tank to wheels” as gas cars.
Gas-engine cars emit over twice as much CO2 as electric cars per unit of energy, and electric cars are at least 4.5 times as efficient at turning energy into miles driven. So gas-engine cars emit at least 9 times (2 times 4.5) as much CO2 per mile driven as electric cars.
Summary: Gas-powered cars emit at least 9 times as much CO2 per mile driven, as electric cars.
Most gas cars are probably more efficient than electric cars, if you take into consideration all the waste in the process of mining and burning the coal and transmitting the electricity from the power plant to wherever the electric car is charged.
This claim is also incorrect. But first, what exactly does it mean? One should count all the energy measured in BTUs associated with all the steps in the processes–exploration, drilling, production, transportation to refineries, refining, delivery to the end location (as well as each car’s efficiency at energy consumed per mile, calculated above)–and see if they add up to less for a gas-engine car than for an electric car. Then to this amount, add the energy measured in cost and waste as well as BTUs, required to remediate all the associated health and environmental damage, to provide necessary military protection to energy industries, and to remediate climate change in California. It’s beyond the goals of this article to fully quantify all these elements, but clear, strong conclusions can be drawn.
Exploration, Drilling, Refining and Distribution of Oil and Gasoline Versus Natural Gas
Natural gas must be discovered, drilled, refined and distributed hundreds or thousands of miles first to refineries then to electrical generating stations. California receives most of its natural gas by pipeline from production in the Rocky Mountains, the Southwest, and western Canada. It is efficiently transported from these sources to power plants through pipelines. Where end use is not electricity generation–therefore not applicable here–natural gas is transported less efficiently, by rail and truck. From the power plant, the electricity must be transmitted and distributed to where the electric cars are charged. Transmission and distribution losses are about 6%.
Oil must be discovered, drilled, refined and distributed hundreds or thousands or tens of thousands of miles first to refineries then to gas stations where cars fill up. Half of California’s oil is drilled in California (including off-shore wells), half is imported “mostly from the Middle East, South America and Africa, according to the California Energy Commission.” Unlike electricity transmission and distribution, the cost of distributing gasoline varies greatly because of differing sources, the methods and length of the distribution channel, the end location of the gas station, the type of gasoline and other factors.
Exploration and drilling are broadly similar for oil and natural gas. Both are often found together. Processing natural gas is somewhat simpler than refining oil. Pipelines are the most efficient means of transporting oil and natural gas, followed by tankers which are used to bring oil to California from the around the world. Also, transporting gasoline from refineries to gas stations is mostly by rail and truck, which are significantly less efficient than pipelines or tankers and far less efficient than transmitting electricity by wire.
Finally, in California, at least 35% of electric car “fuel” is from renewables. How this relates to efficiency may seem somewhat ambiguous; for example solar panels are rarely more than 20% efficient in terms of the amount of sunlight they convert to electricity. However because the fuel for renewables is virtually limitless and free, there is effectively no cost for the “wasted” fuel. On the other hand, there is significant cost and waste in all steps related to supplying fossil fuels, whether directly for gas cars or indirectly for electric cars.
Additional benefits to electric cars are that the driver needn’t drive anywhere to “fill up,” and electric charging stations needn’t be periodically removed and replaced as the underground tanks at gas stations do.
Summary: Significantly more energy is required for oil and gasoline transport from wells to the end user (gas station), than for fuel transport from wells to electrical generating plants and electricity transmission and distribution to the end user (home or office or other charging station).
Health and Environmental Considerations
It would be tremendously complex and being controversial, subject to loud argument, to quantify all the health and environmental issues related to the natural gas and oil and gasoline industries. A brief summary of the issues is followed by a cautious conclusion.
Health and environmental issues associated with natural gas include (from here and here):
- Groundwater contamination
- Disposal of wastewater
- Control of air pollutants
- Climate change considerations including CO2 from combustion and methane from leakage
- Radioactivity
- Earthquakes
Health and environmental issues associated with oil and gas include:
- Toxicity of the oil
- Air, water and land pollution
- Climate change – CO2 primarily from combustion
- Release of volatile organic compounds
- Spills
- Waste oil
Almost all natural gas in the US is now produced by fracking. Almost all new oil production in the US comes from fracking (because of fracking, the US will soon pass Saudi Arabia as the world’s largest oil producer). While some issues of natural gas production (notably methane leakage) do not apply anywhere near as much to oil production, there are also dangers of oil production that do not apply to natural gas (notably oil spills). Issues (fracking and other) are perhaps roughly equivalent between the natural gas and oil industries.
In addition to normal business risks, there are demonstrable risks of disasters from the natural gas supply chain such as when 8 people were killed in a natural gas pipeline explosion in 2010. Note that this involved a pipeline transporting natural gas to be burned for space heating, hot water heating, etc. and was unrelated to electricity generation.
There are far more risks of disasters from the oil and gas supply chain (for example here and here). There do not appear to be any reports of disasters or serious problems related to installation or use of electric car charging stations.
Considering the day-to-day health and environmental costs and risks of the natural gas and oil/gasoline supply chains as roughly equivalent, and that the risks of catastrophe are significantly greater in the oil industry, a conservative conclusion is:
Summary: Significantly more waste from environmental and health issues is associated with the oil and gasoline supply chain from the well to the gas station, than with the fuel and electricity supply chain to the electric car charging station.
Military Protection
Because all California’s natural gas comes from within the US or from Canada, and because the price of natural gas, unlike oil, is not priced similarly around the world, no significant military protection is needed. The primary reason natural price varies so widely is because it costs so much to compress it into a liquid for export and then uncompress it back for distribution. Prices are several times as much in some areas of the world as in others. Currently, natural gas in the US is $3.84 per million BTUs, about $9.24 in Europe (over double the US), and $17.17 in Japan (over four times the US). Electrical transmission and distribution lines, though somewhat unprotected from attack, also do not have and do not yet appear to need significant military protection.
Summary: There is no significant military involvement in protecting the energy supply for electric cars.
On the other hand, there is an enormous expense associated with the military effort to protect vulnerable elements of the oil industry. Because California imports half its oil from the Middle East, South America and Africa, some of the military expense should be factored in.
The United States pays billions of dollars annually to our friend-enemies for their oil. We imported about 1.3 billion barrels from OPEC countries in 2013, so at the current price of $85 per barrel (the lowest it’s been in two years), that’s over $100 billion per year. Our ally Saudi Arabia is not Canada; they beheaded 79 people in 2012-13, for “crimes” including adultery, sorcery, blasphemy. But we have to pay for oil anywhere we get it, so these dollars, though they may not be put to good use, don’t add to the overall expense or “inefficiency.”
Much more relevant to the efficiency question, we also spend many billions to protect our oil interests from sabotage and piracy, for example with the military might of our Fifth fleet. A good estimate puts this protection cost at $500 billion per year. We are continuously at war over oil (we are very unlikely to go to war over natural gas because we have so much domestic supply). The US military itself consumes billions of gallons of fuel per year, but much more significantly, thousands of Americans died in the oil-related wars in Iraq and Afghanistan, tens of thousands came home with major injuries, and hundreds of thousands have long-lasting mental injuries (PTSD or traumatic brain injuries). These enormous sacrifices are some of the “inefficiencies” in the supply chain that takes oil from the wells to the refineries.
What is California’s share? The good news is California ranks 49 of 50 states in per-capita energy consumption. This is partly because of our good climate, partly because of vigorous energy efficiency policies. However, we are a large and populous state and we consumed 1,700 trillion BTUs of gasoline in 2012. World consumption of gasoline is about 20 million barrels per day (http://www.indexmundi.com/energy.aspx/?product=gasoline&graph=consumption). World consumption of oil is about 90 million barrels per day so gasoline is about 22% of the total.
To normalize the units, one gallon of gasoline contains 114,000 BTUs. So 1,700 trillion BTUs in a year divided by 114,000 means California consumes about 15 billion gallons per year. Divide 15 billion by 365 to get 41 million gallons per day. Divide 41 million by 42 (gallons in a barrel) and the result is California consumes about 1 million barrels per day, about 1/20th of world gasoline consumption.
Though we import “only” half our oil, we owe our share of protection money to keep the world’s oil safe to prevent price spikes. Unlike natural gas with enormously expensive export and import facilities necessary for global shipment, oil can be relatively more easily loaded onto tankers for shipment. With significant supply and demand changes or impactful news, the price of oil spikes and drops around the world relatively evenly.
With gasoline at 22% of all oil products, California’s share is about 1/20th of 22% of $500 billion, or about $5.5 billion per year to protect our oil. California consumes 15 billion gallons of gasoline per year, so $5.5 billion divided by 15 billion means California owes about 36¢ per gallon to protect our oil supply.
Gasoline in California currently costs about $3.67 per gallon. Included in that is 18.4¢ per gallon in Federal tax, but that barely covers construction and maintenance of highways and bridges. So the 36¢ per gallon for protection is not included in the $3.67 we pay at the gas station. In economics terms, it is an external cost or “externality,” a subsidy hidden from the price at the gas station pump.
The $500 billion per year for military protection of oil is just one estimate. And charging California’s $5.5 billion per year as its rightful “share” of oil-protection money would be menacingly unpopular. Still, it is straightforward to conclude:
Summary: There is enormous waste (and casualties) for the military protection of the oil supply chain required for our gas cars.
Climate Change Remediation
Another large cost, for both electric cars powered partly by natural gas and for gas-engine cars, is the cost of managing climate change caused by emissions of CO2. California passed into law and is implementing a mechanism to price CO2 emissions – the California Air Resources Board Cap-and-Trade Program. The goal of the program is to bring California greenhouse gas emissions to 1990 levels by 2020. To accomplish that, over time as decreasing amounts of CO2 emissions are legally allowed, emitters must pay either for less polluting equipment or for their CO2 emissions on a dollars per ton basis. The current price is about $12 per ton of CO2 and is expected to rise to about $15 per ton by 2020.
At 15 billion gallons of gasoline consumed per year, and 20 lbs of CO2 emitted per gallon of gasoline burned, the cost of $12 per ton can be extrapolated to $15 billion times 20 lbs divided by 2000 (lbs per ton) times $12 or about $1.8 billion per year. Dividing $1.8 billion by 15 billion gives approximately 12¢ per gallon as the hidden subsidy for CO2 emissions in California.
The cost of the Cap-And-Trade program is a hidden subsidy now but not for long. Transportation fuels have been exempt but the exemption ends on Dec. 31, 2014. We will soon see the roughly 12¢ per gallon hidden subsidy becoming visible in the price of gasoline at the pump in California.
CO2 emissions from burning natural gas have also been exempt, and that exemption also ends on Dec 31, 2014. Because gas cars emit about 9 times as much CO2 per mile driven as electric cars, the hidden CO2 subsidy is also about 9 times as much for gas cars.
Summary: There is over 9 times as much cost based on California climate change remediation for gas cars, than for electric cars.
Conclusions
In conclusion, electric cars in California emit far less CO2 than gas-engine cars, and are far more efficient, even considering the entire supply chain from “well to tank” and from “tank to wheels.”
Beyond the emissions and efficiency comparisons, there are a few other important comparisons. Electric cars are also much cheaper to drive, and with the single exception of “range anxiety” (that you’ll be left stranded when your batteries run out), are much more fun to drive than gas-engine cars (see a presentation on “The Joys of Driving an Electric Car“). Range anxiety is caused by the scarcity of charging stations, and the amount of time required to charge batteries. Both of these problems are being solved, with Tesla leading the way by building hundreds of charging stations across the state, country and world, and implementing a battery-swap so that a “refill” takes less time than to fill up a tank of gas.
Electric cars are inherently far simpler than gas-engine cars, and so will eventually become much cheaper as battery technology improves (and especially if the price of oil rebounds). Again, Tesla is leading, building a huge battery factory that is expected to reduce the price of batteries by 30% by 2017.
Finally, if climate change turns out to be anywhere near as formidable as reported and predicted by the International Panel on Climate Change (IPCC), burning gasoline, natural gas and other CO2-emitting fuels must diminish, soon and forever.